A piece of knowledge in anthropometry
As an example we take a door (see figure). If we would like to determine the recommend height of it we use the normal distribution for stature and pick a value somewhere at the high end. We could for instance include 99% of the target population to make sure that almost everyone can pass the door without bending. This is quite a save decision, as smaller people won’t be bothered by a door that is too high. Take home message: don’t design a door height for the average person because than 50% will bump his/her head.
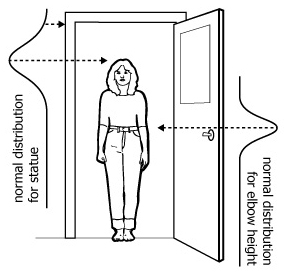
You could repeat this process for the height of the door handle, using the elbow height. In that case you would probably use the average, as tall or short people can respectively reach a bit lower or higher. However, when for instance the elbow height of your population turns out to spread over a large range or you are dealing with multiple different populations (i.e. children and adults) you might consider installing multiple door handles.
These three design types: higher, average and variants are three of the in total seven ways in which anthropometric data can be used in design.
Take home message: for each product dimension you need a relevant body dimension and hope this has mean measured or estimated for your target group.
Thereafter you have to decide which part of the normal distribution is critical: the lower end (as for a control button in the elevator) or the upper end like in a door height or the average like in the door handle. The lower end is mostly expressed as P5, P3 or P1 depending on how many people you want to exclude. Please remember P1 in the Netherland is already 1% of 17 million=170.000 people. Also the higher end is mostly represented by P95, P97 or P99. And always impressive is the following: Europe has about 500Million people. So P5 EU is 5*5,000,000=25 million is about the size of the Benelux. If EU decides the door height according to P95, it excludes the tall Dutch, Belgium and Luxemburg people.